Long description: Block261_Fig1
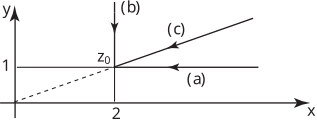
Alt text: A two-dimensional graph illustrates three vectors labeled (a), (b), and (c) originating from a point labeled \(z_0\) on the complex plane.
This description was generated by AI and has not been verified by a human. If you spot an error, please use the feedback link below.
- The image displays a Cartesian coordinate system with the horizontal axis labeled \(x\) and the vertical axis labeled \(y\).
- A point labeled \(z_0\) is marked at a specific location on the complex plane, corresponding to coordinates \((2, 1)\) on the visible axes.
- Panel (a) shows a dashed line extending horizontally to the left from the point \(z_0\), indicating a vector parallel to the \(x\)-axis.
- Panel (b) shows a solid vertical line segment rising upward from the point \(z_0\), indicating a vector parallel to the \(y\)-axis.
- Panel (c) depicts a solid line segment originating from the point \(z_0\) and extending upward and to the right, forming the hypotenuse of a right triangle defined by the projections of vectors (a) and (b).