Long description: Fig361a
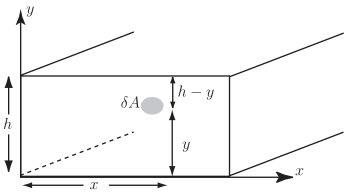
Alt text: A diagram illustrating cross-sectional area measurements, showing dimensions labeled with 'h' and 'y' along the vertical axis and 'x' along the horizontal axis.
This description was generated by AI and has not been verified by a human. If you spot an error, please use the feedback link below.
- The image is a two-dimensional graph with the vertical axis labeled with 'y' and the horizontal axis labeled with 'x', indicating a coordinate system.
- A rectangular region is depicted, representing a cross-section with a total height labeled 'h' and a width that extends along the 'x' axis.
- Within this rectangular region, a shaded area labeled '\(\text{d}A\)' is shown, positioned at a vertical height indicated by the difference '\(\text{h} - \text{y}\)' from the top edge.
- A vertical dashed line segment shows the height '\(\text{y}\)' from the bottom edge to the center of the shaded area.
- A dashed diagonal line passes through the bottom-left corner of the visible rectangular structure, suggesting a surface or boundary within the illustrated volume.