Long description: fig1
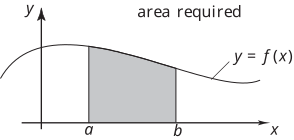
Alt text: A graph showing the area under a curve defined by the function y = f(x) between the vertical lines x = a and x = b.
This description was generated by AI and has not been verified by a human. If you spot an error, please use the feedback link below.
- The image displays a coordinate system with the horizontal axis labeled x and the vertical axis labeled y.
- A continuous curve, representing the function y = f(x), is plotted across the graph.
- The region beneath the curve, bounded by the function, the x-axis, and the vertical lines x = a and x = b, is shaded gray.
- The area of this shaded region is labeled "area required," illustrating the definite integral of the function over the specified interval.