Long description: fig2
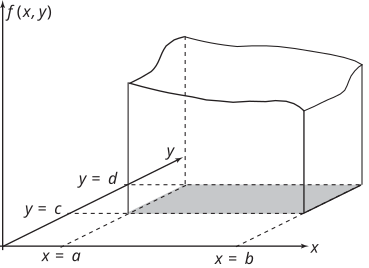
Alt text: A three-dimensional graph showing a surface defined by the function f(x, y) over a rectangular region in the xy-plane.
This description was generated by AI and has not been verified by a human. If you spot an error, please use the feedback link below.
- The image displays a three-dimensional graph with the vertical axis labeled with "f(x, y)".
- The horizontal plane represents the input variables, with an axis labeled with "x" and another labeled with "y".
- The surface itself shows a curved shape rising above the base region, indicating a function of two variables.
- The base of the surface is defined over a rectangular region extending from "x = a" to "x = b" along the "x" axis and from a lower bound to "y = d" along the "y" axis.
- Several dashed lines and labels indicate the boundaries of the region, including "x = a," "x = b," "y = c," and "y = d," providing context for the domain of the function.