Long description: fig3
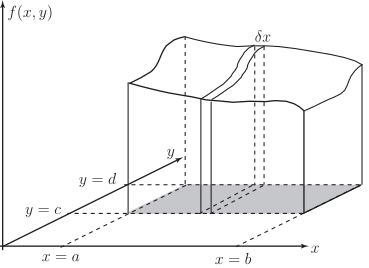
Alt text: A three-dimensional graph illustrating the concept of a surface integral over a rectangular region.
This description was generated by AI and has not been verified by a human. If you spot an error, please use the feedback link below.
- The image displays a three-dimensional surface defined by a function \(f(x, y)\).
- The horizontal axes represent variables \(x\) and \(y\), with the range for \(x\) extending from \(x = a\) to \(x = b\), and the range for \(y\) extending from an implied lower bound up to a line labeled \(y = d\).
- A portion of the surface is shaded with cross-hatching, indicating the region of integration.
- Several vertical dashed lines indicate the extent of the integration domain: one line corresponds to \(x = a\) and another to \(x = b\). A dashed line labeled \(\delta x\) indicates a small change in the \(x\) direction.
- Another set of vertical dashed lines show the dependence on \(y\), with one line corresponding to \(y = c\) and another extending up to \(y = d\). A vertical dashed line labeled \(\delta y\) is implied by the structure, indicating a small change in the \(y\) direction.
- The axes are labeled with the function \(f(x, y)\) on the vertical axis, and \(x\) and \(y\) on the horizontal axes.