Long description: Fig363_1
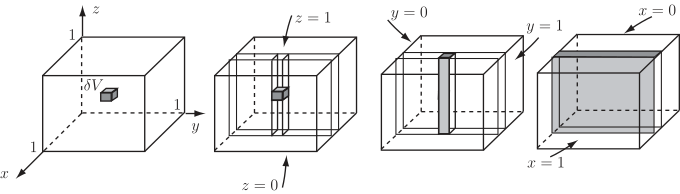
Alt text: Four diagrams illustrate the process of taking three successive slices from a volume, representing triple integration.
This description was generated by AI and has not been verified by a human. If you spot an error, please use the feedback link below.
- The first diagram shows a cube with a small rectangular volume element, \(\Delta\text{V}\), located inside it, and shows coordinate axes labeled \(x\), \(y\), and \(z\) ranging from zero to one.
- The second diagram shows a slice taken perpendicular to the \(z\)-axis at a value of \(z=1\), representing the integration with respect to \(z\).
- The third diagram shows a slice taken perpendicular to the \(y\)-axis at a value of \(y=0\), illustrating the next integration step.
- The fourth diagram shows the resulting interior region, which is a gray-shaded rectangular volume, indicating the limits of the triple integral with respect to \(x\) from zero to one, \(y\) from zero to one, and \(z\) from zero to one.