Long description: Fig363a_5
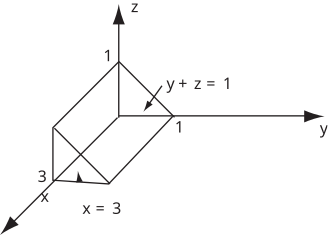
Alt text: A three-dimensional graph showing a bounded region defined by the planes \(x=3\), \(y=0\), \(z=0\), and \(y+z=1\).
This description was generated by AI and has not been verified by a human. If you spot an error, please use the feedback link below.
- The image displays a three-dimensional coordinate system with axes labeled \(x\), \(y\), and \(z\).
- A triangular plane is shown in the positive octant, defined by the equation \(y+z=1\). The intercepts of this plane appear to be at \((0, 1, 0)\) and \((0, 0, 1)\) when considering the plane itself.
- The region is bounded on the \(x\)-axis by the plane \(x=3\). The extent of the region along the positive \(x\)-axis is marked at \(x=3\).
- The base of the visible shape appears to lie on the plane \(z=0\) and \(y=0\), although the visible bounding surfaces are more explicitly defined by the planes \(x=3\), \(y+z=1\), \(z=0\), and \(y=0\) (implied by the positive octant view and the nature of the bounding planes).