Long description: Fig363b_5
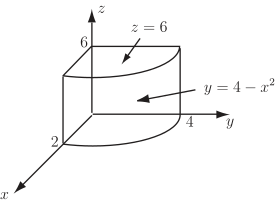
Alt text: A three-dimensional graph shows a solid region bounded by the planes \(z=6\), \(y=4-x^2\), \(z=0\), and the coordinate planes.
This description was generated by AI and has not been verified by a human. If you spot an error, please use the feedback link below.
- The image is a three-dimensional graph illustrating a solid region in the first octant, defined by the coordinate axes labeled \(x\), \(y\), and \(z\).
- The solid is bounded above by the horizontal plane \(z=6\) and below by the \(xy\)-plane (\(z=0\)).
- The side boundaries are defined by the plane \(y=4-x^2\) and the coordinate planes.
- The visible surfaces indicate that the solid is projected onto the \(xy\)-plane and then capped by the plane \(z=6\).
- The projection onto the \(xy\)-plane appears to be bounded by the curve \(y=4-x^2\) and the \(x\)-axis (and implicitly, the \(y\)-axis, given the context of typical integration problems, though only \(y=4-x^2\) is explicitly labeled on the side face).