Long description: Fig36410
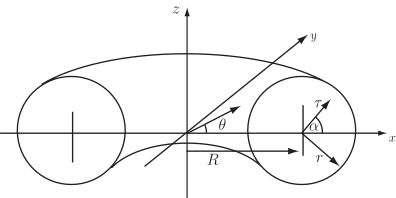
Alt text: A diagram on a two-dimensional coordinate system showing two intersecting ovals with labeled parameters for polar and Cartesian coordinates.
This description was generated by AI and has not been verified by a human. If you spot an error, please use the feedback link below.
- The image displays a two-dimensional coordinate system with labeled axes for \(z\) (vertical) and \(x\) (horizontal).
- Two overlapping, oblong shapes, resembling ovals or ellipses, are drawn across the plane.
- On the left oval, a radial line segment is drawn along the \(x\)-axis, labeled with the parameter \(R\).
- On the right oval, a set of polar coordinates is indicated: a radial line segment is drawn along the \(x\)-axis, labeled with the parameter \(r\), and an angle \(\theta\) is shown between this line and the positive \(x\)-axis. Another angle, \(\tau\), is shown relative to the \(y\)-axis on the right oval.
- Several vectors and angles are present: \(\theta\) is shown as an angle measured from the positive \(x\)-axis to a radial line on the right oval. A line segment labeled \(R\) extends horizontally across the left oval, suggesting a characteristic length or radius.
- The diagram illustrates concepts related to changing coordinates, likely involving generalized polar or curvilinear coordinates.