Long description: Fig37114
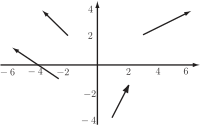
Alt text: A two-dimensional grid shows several vectors illustrating the vector field \(\underline{v} = x\underline{i} + 2\underline{j}\).
This description was generated by AI and has not been verified by a human. If you spot an error, please use the feedback link below.
- The image displays a standard Cartesian coordinate system with an x-axis ranging from approximately negative six to positive six, and a y-axis ranging from negative four to positive four.
- Several black arrows are drawn on the grid, representing vectors in the plane.
- At the point approximately \((-6, 0)\), a vector points upwards and to the right.
- At the point approximately \((-4, -2)\), a vector points downwards and to the right.
- At the point approximately \((-2, 2)\), a vector points upwards and to the right.
- At the point approximately \((2, -4)\), a vector points strongly upwards, nearly vertically.
- At the point approximately \((4, 2)\), a vector points upwards and to the right.