Long description: Fig37115
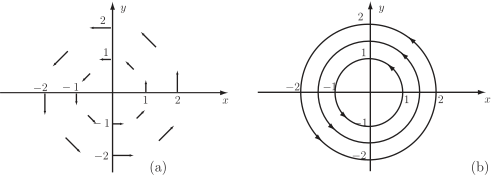
Alt text: The image displays two graphs, (a) showing scattered vectors on a coordinate plane and (b) showing field lines forming concentric circles.
This description was generated by AI and has not been verified by a human. If you spot an error, please use the feedback link below.
- Panel (a) illustrates several short vectors drawn at various points on a two-dimensional coordinate system with the horizontal axis labeled \(x\) and the vertical axis labeled \(y\).
- The vectors in panel (a) generally point away from the origin, with the direction and magnitude appearing to vary across the plane, suggesting a vector field.
- Panel (b) displays the same region but shows the vector field represented by smooth, continuous field lines.
- These field lines form a pattern of concentric closed curves centered at the origin, where the curves are labeled with values like \(1\), \(-1\), and \(-2\) in both the \(x\) and \(y\) directions along the axes.
- The overall transition from panel (a) to panel (b) suggests a visualization where discrete vectors are smoothly modeled into a field line pattern.