Long description: fig16
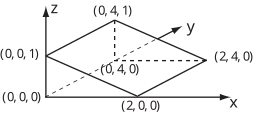
Alt text: A diagram illustrating a parallelogram in three-dimensional coordinate space defined by its vertices and projected onto the x, y, and z axes.
This description was generated by AI and has not been verified by a human. If you spot an error, please use the feedback link below.
- The image displays a three-dimensional coordinate system labeled with the axes x, y, and z.
- A parallelogram, representing a planar surface, is drawn in the positive octant of the coordinate system.
- The vertices of the parallelogram are labeled with their corresponding coordinates: (0, 0, 1), (2, 4, 0), (0, 4, 1), and (0, 4, 0).
- Dashed lines indicate projections or edges connecting the vertices, such as the line segment connecting (0, 0, 1) to (0, 4, 1), and the segment connecting (0, 4, 0) to (2, 4, 0).
- The coordinates (0, 0, 0), (2, 0, 0), and (0, 4, 0) mark the origin and points on the coordinate axes, establishing the spatial reference for the figure.