Long description: block6-fig1
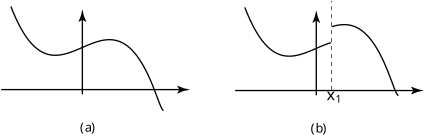
Alt text: The image displays two graphs, (a) showing a continuous function and (b) showing a discontinuous function.
This description was generated by AI and has not been verified by a human. If you spot an error, please use the feedback link below.
- Panel (a) depicts a curve that represents a continuous function, meaning the line can be drawn without lifting the pen from the graph, exhibiting no breaks or jumps.
- Panel (b) depicts a curve representing a discontinuous function, showing a distinct break at a specific point labeled \(x_1\), indicating a jump discontinuity.