Long description: block6-fig2
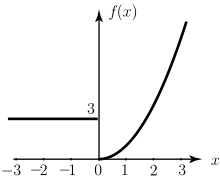
Alt text: The graph shows a piecewise function that is constant for negative x-values and curves upward for positive x-values, exhibiting a jump discontinuity at x equals 0.
This description was generated by AI and has not been verified by a human. If you spot an error, please use the feedback link below.
- The horizontal axis represents the variable \(x\), and the vertical axis represents the function \(f(x)\).
- For all values of \(x\) less than \(0\), the graph is a horizontal line at the height of \(y=3\).
- At \(x=0\), the function has a jump discontinuity.
- For all values of \(x\) greater than or equal to \(0\), the graph is a curve that passes through the origin \((0, 0)\) and increases sharply as \(x\) increases, resembling a portion of a parabola or power function.