Long description: block6-fig3
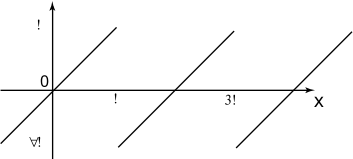
Alt text: A graph showing several lines plotted on a coordinate system with the x-axis labeled with factorials starting from zero factorial to three factorial.
This description was generated by AI and has not been verified by a human. If you spot an error, please use the feedback link below.
- The image displays a two-dimensional Cartesian coordinate system with a horizontal x-axis and a vertical y-axis.
- The x-axis is labeled with factorials, marking positions at \(0!\), \(1!\), and \(3!\).
- Several straight lines are drawn on the graph, passing through or near these labeled points.
- These lines appear to represent functions plotted against the factorial sequence on the horizontal axis.