Long description: block6-fig8
Alt text: A graph showing multiple upward-curving functions plotted against the x-axis, with one function appearing to pass through the origin.
This description was generated by AI and has not been verified by a human. If you spot an error, please use the feedback link below.
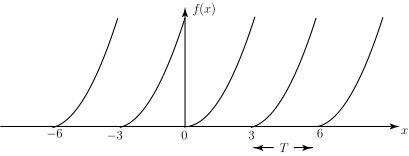
- The image displays a Cartesian coordinate system with the horizontal axis labeled as \(x\) and the vertical axis labeled as \(f(x)\).
- Several continuous, upward-curving functions are plotted across the graph, indicating that the function's value increases as the \(x\) value increases.
- At \(x=0\), a specific vertical line segment or function component is shown, suggesting a point of discontinuity or a distinct feature at the origin.
- For \(x\) values less than zero, the visible curves are decreasing rapidly from the upper left, suggesting they might be defined for negative \(x\) values.
- As \(x\) increases from the negative values towards positive values, the plotted curves appear to be increasing functions that resemble parabolas or exponential growth curves.