Long description: block6-fig9
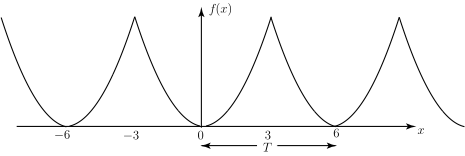
Alt text: A graph showing a periodic, wave-like function, f(x), centered around the x-axis and repeating over intervals of T.
This description was generated by AI and has not been verified by a human. If you spot an error, please use the feedback link below.
- The image displays a continuous graph of a function, labeled \(f(x)\), plotted against the horizontal axis, labeled \(x\).
- The function exhibits a periodic wave shape, characterized by multiple peaks and valleys.
- The horizontal axis indicates the variable \(x\), marked at positions such as negative six, negative three, zero, three, and six.
- The graph appears to repeat its shape over an interval labeled \(T\), which spans from negative three to three, and from zero to six.
- Specifically, the function crosses the horizontal axis (the x-axis) at \(x=-3\), \(x=0\), and \(x=3\) in the visible portion of the graph.
- The function's value, \(f(x)\), is plotted vertically, with the y-axis marked \(f(x)\).