Long description: block6-fig4
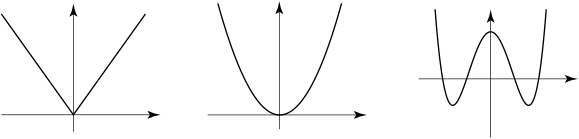
Alt text: Three graphs are displayed side-by-side, showing the shapes of various mathematical functions.
This description was generated by AI and has not been verified by a human. If you spot an error, please use the feedback link below.
- The leftmost graph shows a V-shape, characteristic of an absolute value function, with its vertex at the origin.
- The middle graph displays a parabola opening upwards, resembling the graph of a quadratic function, with its minimum point at the origin.
- The rightmost graph illustrates a continuous, wave-like curve that oscillates around the horizontal axis.