Long description: block6-fig6
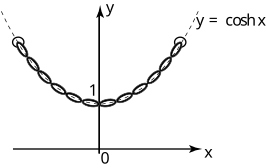
Alt text: A graph showing the hyperbolic cosine function, \(y = \text{cosh}(x)\), plotted on a coordinate plane.
This description was generated by AI and has not been verified by a human. If you spot an error, please use the feedback link below.
- The graph displays a smooth, U-shaped curve representing the function \(y = \text{cosh}(x)\).
- The horizontal axis is labeled \(x\), and the vertical axis is labeled \(y\).
- The curve passes through the point \((0, 1)\) on the \(y\)-axis.
- The graph is symmetric with respect to the vertical \(y\)-axis.
- As the value of \(x\) moves away from zero in either the positive or negative direction, the value of \(y\) increases rapidly, forming a characteristic