Long description: block6-fig7
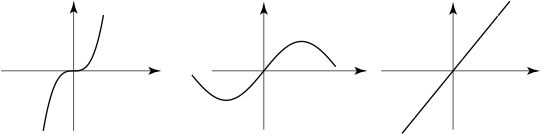
Alt text: The image displays three graphs plotted on a Cartesian coordinate system, illustrating different types of functions.
This description was generated by AI and has not been verified by a human. If you spot an error, please use the feedback link below.
- The graph on the left shows a function with a V-shape or an absolute value shape, resembling the graph of \(y = |x|\), passing through the origin with its vertex at \((0, 0)\).
- The graph in the center shows a smooth, wave-like curve that oscillates horizontally, resembling a cosine or sine wave, passing through the origin.
- The graph on the right shows a straight line that passes through the origin with a positive slope, representing a linear function of the form \(y = mx\).