Long description: block7-fig1
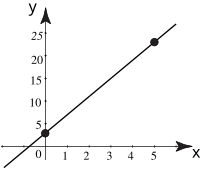
Alt text: The image displays a straight line plotted on a two-dimensional coordinate system with marked points at (0, 5) and (5, 25).
This description was generated by AI and has not been verified by a human. If you spot an error, please use the feedback link below.
- The visualization is a Cartesian coordinate plane with the horizontal axis labeled \(x\) and the vertical axis labeled \(y\).
- The straight line passes through the point where \(x\) equals zero and \(y\) equals five.
- The line also passes through a second marked point where \(x\) equals five and \(y\) equals twenty-five.
- The line is in an increasing trend, meaning as the value of \(x\) increases, the value of \(y\) also increases.