Long description: block7-fig3
Alt text: A graph showing two straight lines intersecting on a two-dimensional coordinate plane.
This description was generated by AI and has not been verified by a human. If you spot an error, please use the feedback link below.
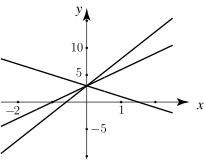
- The image displays a standard two-dimensional Cartesian coordinate system with a horizontal x-axis and a vertical y-axis.
- Two distinct straight lines are plotted on the coordinate plane, intersecting at a single point.
- The axes are marked with numerical values, extending at least from -5 to 1 on the x-axis and -5 to 10 on the y-axis.
- One line passes through the points (1, 0) and appears to have a negative slope.
- The second line also passes through the point (1, 5) and appears to have a positive slope.
- The point of intersection for the two lines is located at the coordinates (1, 5).