Long description: block7-fig4
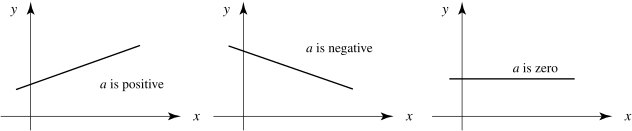
Alt text: Three graphs illustrate the relationship between the gradient, \(a\), and the equation of a straight line, \(y=ax+b\).
This description was generated by AI and has not been verified by a human. If you spot an error, please use the feedback link below.
- The first graph shows a line sloping upwards from the origin, labeled "a is positive", indicating a positive gradient.
- The second graph displays a line sloping downwards, labeled "a is negative", indicating a negative gradient.
- The third graph shows a horizontal line parallel to the x-axis, labeled "a is zero", indicating a zero gradient.