Long description: circle1
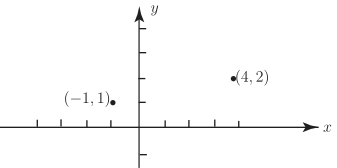
Alt text: A graph with an x-axis and y-axis showing two points plotted at coordinates (-1, 1) and (4, 2).
This description was generated by AI and has not been verified by a human. If you spot an error, please use the feedback link below.
- The image displays a standard two-dimensional Cartesian coordinate system with a horizontal x-axis and a vertical y-axis.
- There are two distinct points marked on the graph.
- The first point is plotted at the coordinates negative one, one (\(-1, 1\)).
- The second point is plotted at the coordinates four, two (\((4, 2)\)).