Long description: circle7
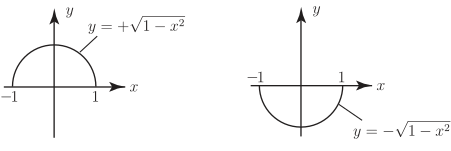
Alt text: Two graphs show equations on a coordinate plane: the first is a semi-circle defined by \(y = +\sqrt{1 - x^2}\), and the second is an inverted semi-circle defined by \(y = -\sqrt{1 - x^2}\).
This description was generated by AI and has not been verified by a human. If you spot an error, please use the feedback link below.
- The image contains two separate graphs plotted on two respective two-dimensional coordinate planes.
- The graph on the left displays the function \(y = +\sqrt{1 - x^2}\) as a semi-circle that opens upwards, centered at the origin, with its diameter lying along the \(x\)-axis and passing through the points \((-1, 0)\) and \((1, 0)\).
- The graph on the right displays the function \(y = -\sqrt{1 - x^2}\) as an inverted semi-circle that opens downwards, centered at the origin, with its diameter lying along the \(x\)-axis and also passing through the points \((-1, 0)\) and \((1, 0)\).
- Both semi-circles have a radius of one unit.