Long description: circle8
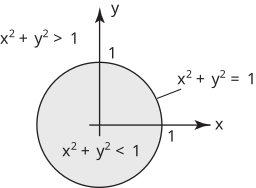
Alt text: A graph showing a shaded circular region centered at the origin, labeled with inequalities.
This description was generated by AI and has not been verified by a human. If you spot an error, please use the feedback link below.
- The image displays a two-dimensional Cartesian coordinate system with the horizontal axis labeled with \(x\) and the vertical axis labeled with \(y\).
- A shaded circular area is visible, centered at the origin \((0, 0)\).
- The boundary of the shaded region is marked and labeled with the equation \(x^2 + y^2 = 1\), which represents a circle with a radius of one unit.
- Inside the shaded region, the inequality \(x^2 + y^2 < 1\) is written, indicating that all points within the circle satisfy this condition.
- Outside the shaded region, an area labeled \(x^2 + y^2 > 1\) suggests the region where points are farther than one unit from the origin.