Long description: Ch25lagpolyJPW
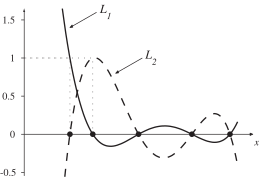
Alt text: A graph shows two curves, \(L_1\) and \(L_2\), plotted against the horizontal axis \(x\), with \(L_1\) being a solid curve and \(L_2\) being a dashed curve.
This description was generated by AI and has not been verified by a human. If you spot an error, please use the feedback link below.
- The graph displays two functions, \(L_1\) and \(L_2\), plotted on a two-dimensional coordinate system where the horizontal axis is labeled \(x\) and the vertical axis ranges from negative point five to one point five.
- The curve \(L_1\), represented by a solid line, starts at a high positive value on the left side of the graph, passes through a local minimum near the vertical axis, and remains mostly close to or below the \(x\)-axis for positive \(x\).
- The curve \(L_2\), represented by a dashed line, starts at a positive value on the left side of the graph, shows an initial peak, and then decreases, crossing the \(x\)-axis and displaying oscillations that remain below the \(x\)-axis for larger positive values of \(x\).
- Both curves intersect the \(x\)-axis at several points, and both curves appear to approach the \(x\)-axis as \(x\) increases to the right.