Long description: bestfitpic-RD
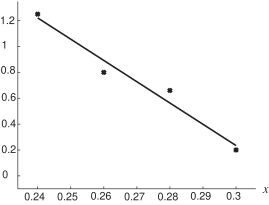
Alt text: A line graph showing a decreasing trend as the x-value increases.
This description was generated by AI and has not been verified by a human. If you spot an error, please use the feedback link below.
- The graph plots a dependent variable against an independent variable labeled \(x\) on the horizontal axis, which ranges from \(0.24\) to \(0.3\) in increments of \(0.01\).
- The vertical axis represents an unnamed quantity, ranging from \(0\) to \(1.2\) in increments of \(0.2\).
- A data point is visible near \((0.24, 1.2)\).
- A second data point is located at approximately \((0.26, 0.8)\).
- A third data point is situated near \((0.28, 0.6)\).
- The final plotted point is observed at \((0.3, 0.18)\).
- A straight line is drawn through these points, illustrating a consistent, negative linear correlation.