Long description: bestfitpicJPW
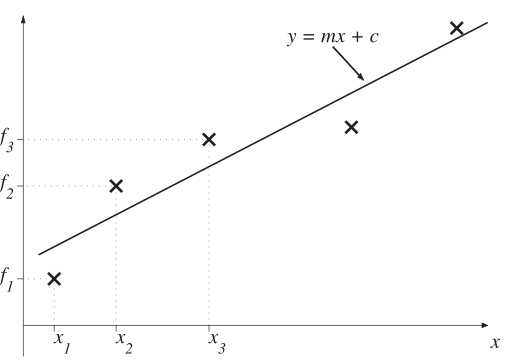
Alt text: A scatter plot shows four data points and a straight line labeled as the equation \(y = mx + c\), indicating a linear approximation.
This description was generated by AI and has not been verified by a human. If you spot an error, please use the feedback link below.
- The image displays a two-dimensional Cartesian graph with the horizontal axis labeled \(x\) and the vertical axis labeled \(f\).
- Four distinct data points are plotted on the graph.
- The points are marked at approximate coordinates relative to the axes labels \(x_1\), \(x_2\), \(x_3\), and a fourth point further to the right.
- A straight line is drawn passing through or near these data points, representing the equation \(y = mx + c\).
- Dashed horizontal and vertical lines are drawn to project the coordinates of the data points onto the respective axes for clarity.