Long description: Ch25splineJPW
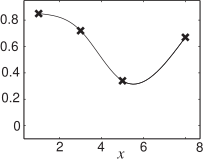
Alt text: A graph showing a curve passing through several marked points that decreases and then increases.
This description was generated by AI and has not been verified by a human. If you spot an error, please use the feedback link below.
- The image displays a coordinate graph with the horizontal axis labeled as \(x\) and the vertical axis with numerical markings from \(0\) to \(0.8\) in increments of \(0.2\).
- A plotted curve with visible data points traces a shape that resembles a 'U' or a segment of a parabola.
- The curve starts at a high value near \(x=2\), specifically around \(0.8\).
- It then slopes downward, passing through a point near \(x=4\) with a value of approximately \(0.7\).
- The curve continues to decrease, reaching a minimum value between \(x=5\) and \(x=6\), close to \(0.3\).
- From this minimum, the curve begins to rise, passing through a point near \(x=8\) with a value of approximately \(0.6\).