Long description: Ch25trappicJPW
Alt text: A graph with a shaded region under a curve, illustrating the area between x-values a and b.
This description was generated by AI and has not been verified by a human. If you spot an error, please use the feedback link below.
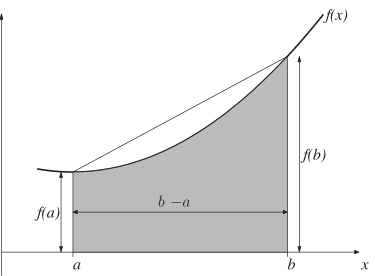
- The image displays a graph with a horizontal axis labeled \(x\) and a vertical axis (unlabeled, but representing function values).
- A continuous, increasing curve, labeled \(f(x)\), is drawn across the graph.
- A rectangular region is shaded underneath the curve, starting at \(x=a\) and ending at \(x=b\).
- Vertical lines mark the boundaries \(x=a\) and \(x=b\) on the horizontal axis.
- The height of the shading at the left boundary is labeled \(f(a)\), and the height at the right boundary is labeled \(f(b)\).
- The width of the shaded region is indicated by a bracket labeled \(b-a\) on the horizontal axis, representing the interval length.