Long description: Ch25comp3trappicJPW
Alt text: A graph illustrating three shaded rectangles underneath a curve, representing approximations of a definite integral.
This description was generated by AI and has not been verified by a human. If you spot an error, please use the feedback link below.
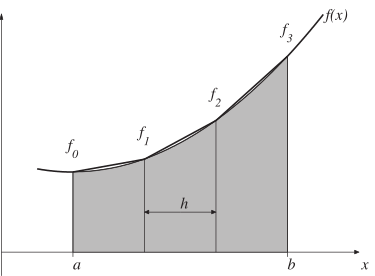
- The image displays a graph with the horizontal axis labeled "x" and the vertical axis with no explicit label.
- A curve, labeled as \(f(x)\), is drawn, generally increasing from left to right.
- Below the curve, three adjacent shaded rectangular areas are shown, positioned between the vertical lines \(x=a\) and \(x=b\).
- The first shaded rectangle, labeled \(f_0\), spans from an implicit starting point up to \(x=a\).
- The second shaded rectangle, labeled \(f_1\), spans from \(x=a\) to an intermediate point.
- The third shaded rectangle, labeled \(f_2\), spans from the intermediate point to another point.
- A fourth, larger shaded area, labeled \(f_3\), spans from the intermediate point to the right boundary at \(x=b\).
- A horizontal arrow labeled "\(h\)" indicates the width of the second and third shaded rectangles, suggesting a uniform width or sequence of partitions.
- The overall setup illustrates the process of approximating the area under the curve \(f(x)\) between \(x=a\) and \(x=b\) using three distinct rectangles.