Long description: cubic
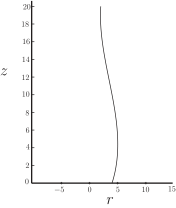
Alt text: A graph showing a curve that is defined for positive values of the horizontal axis variable and a range of values on the vertical axis.
This description was generated by AI and has not been verified by a human. If you spot an error, please use the feedback link below.
- The image is a two-dimensional Cartesian graph with the horizontal axis labeled \(t\) and ranging from \(-5\) to \(15\), and the vertical axis labeled \(z\) and ranging from \(0\) to \(20\).
- A single, smooth, black curve is plotted on the graph, rising steeply from the horizontal axis as \(t\) increases.
- The curve starts at or near \(t=0\) and appears to be defined only for \(t\) values greater than approximately \(0\).
- The curve increases rapidly, passing through points such as \((2, 8)\) and \((4, 15)\).
- The curve continues to ascend sharply, reaching a maximum visible \(z\) value of \(20\) near \(t=1\) (though the plotted portion appears to peak around \(t=1\) and then decline, or the visible portion is simply the right side of a function).
- The curve reaches a point where its vertical extent is minimal, appearing to approach \(z=0\) around \(t=9\) or \(t=10\), where it seems to terminate its visible domain on the positive side of the horizontal axis.