Long description: Ch25ndiffonesideJPW
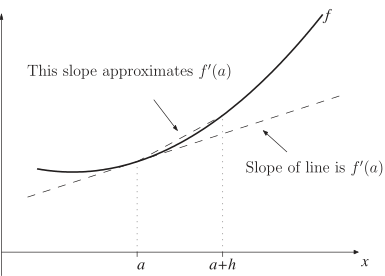
Alt text: A graph shows a curve labeled \(f\) and a dashed line segment representing a slope, both related to the value \(a\) on the horizontal axis.
This description was generated by AI and has not been verified by a human. If you spot an error, please use the feedback link below.
- The image displays a two-dimensional graph with a horizontal axis labeled \(x\) and a vertical axis, which represents the function's value.
- A continuous curve, labeled \(f\), is drawn, representing a function of \(x\).
- A dashed line segment is depicted that intersects the curve at the point corresponding to \(x=a\).
- This dashed line has an arrow pointing to it and is labeled, "Slope of line is \(f'(a)\)", indicating the slope of the tangent line at \(x=a\).
- Another line, which appears to be a secant line or another approximation, is drawn, and an arrow points to it, labeled, "This slope approximates \(f'(a)\)".
- Vertical dotted lines are drawn at two positions on the horizontal axis: one at \(x=a\) and another at \(x=a+h\), where \(h\) is a small positive distance.