Long description: Ch25bispicJPW
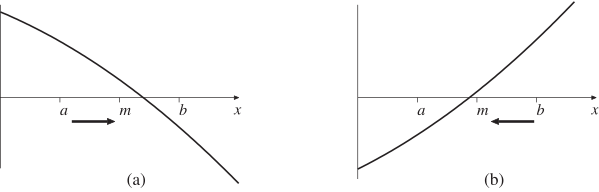
Alt text: The image displays two graphs, (a) and (b), illustrating the behavior of a function over different intervals on the horizontal axis labeled 'x'.
This description was generated by AI and has not been verified by a human. If you spot an error, please use the feedback link below.
- Graph (a) shows a downward-sloping curve that intersects the horizontal axis at a point labeled 'm', with the interval to the left of 'm' indicated by 'a' and the interval to the right of 'm' indicated by 'b'.
- Graph (b) shows an upward-sloping curve that intersects the horizontal axis at the same point labeled 'm', with the interval to the left of 'm' indicated by 'a' and the interval to the right of 'm' indicated by 'b'.