Long description: Ch25newtonpicJPW
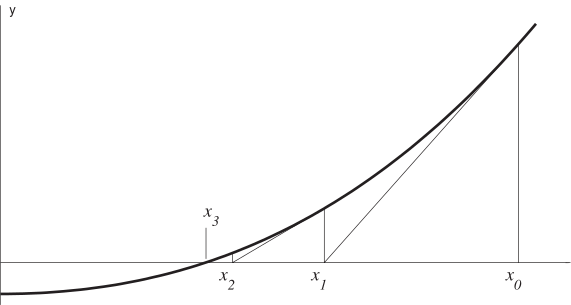
Alt text: A graph shows a curve rising steeply, with vertical lines dropping from the curve at specific points marked on the horizontal axis.
This description was generated by AI and has not been verified by a human. If you spot an error, please use the feedback link below.
- The image displays a two-dimensional graph with the vertical axis labeled "y" and the horizontal axis representing an unlabeled variable, presumably "x".
- A continuous, concave-up curve is drawn across the graph, indicating a function that is increasing in value from left to right.
- Several vertical lines are drawn, originating from points on the curve and terminating at marked points on the horizontal axis.
- These marked points on the horizontal axis are labeled as \(x_0\), \(x_1\), \(x_2\), and \(x_3\), arranged in increasing order from right to left on the axis.
- The vertical line associated with \(x_3\) connects the point \((x_3, y(x_3))\) on the curve to the point \((x_3, 0)\) on the horizontal axis.
- Similar vertical lines connect points on the curve at \(x_2\), \(x_1\), and \(x_0\) down to the horizontal axis, illustrating the concept of the value of the function at these specific \(x\)-coordinates.