Long description: ivpplot
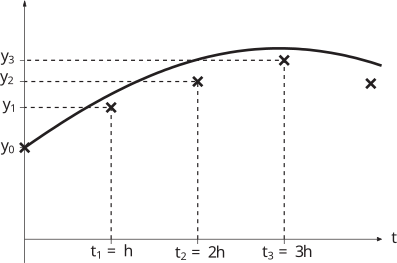
Alt text: A line graph shows a curve starting at a low point, rising to a peak, and then declining over time.
This description was generated by AI and has not been verified by a human. If you spot an error, please use the feedback link below.
- The graph displays a curve plotted on a two-dimensional coordinate system with time (\text{t}) on the horizontal axis and an unspecified value on the vertical axis.
- The curve begins at the initial value, labeled as \(\text{y}_0\).
- The value of the curve increases as time progresses, passing through a point associated with \(\text{t}_1 = \text{h}\) and a level labeled \(\text{y}_1\).
- The curve continues to rise, reaching a local maximum near \(\text{t}_2 = 2\text{h}\), where the value is approximately \(\text{y}_2\).
- After passing the peak, the curve begins to decrease as time advances toward \(\text{t}_3 = 3\text{h}\), where the value is below the \(\text{y}_2\) level.
- The overall trend depicts an increasing, peaking, and then decreasing function over the specified time intervals.