Long description: crankex1
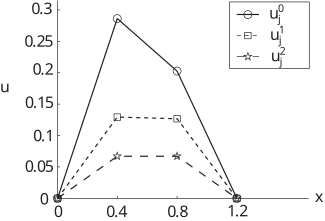
Alt text: A line graph showing three functions, labeled as \(u_j^0\), \(u_j^1\), and \(u_j^2\), plotted against the variable \(x\) over the interval from 0 to 1.2.
This description was generated by AI and has not been verified by a human. If you spot an error, please use the feedback link below.
- The graph plots three curves representing functions of a variable \(x\) on the horizontal axis and a value \(u\) on the vertical axis.
- The solid line, corresponding to \(u_j^0\) (marked with open circles), starts at \((0, 0)\), rises steeply to a peak value of approximately \(0.29\) at \(x=0.4\), and then decreases to \(0.20\) at \(x=0.8\), finally ending at \((1.2, 0)\).
- The dashed line, corresponding to \(u_j^1\) (marked with open squares), also starts at \((0, 0)\), rises to a peak value of approximately \(0.12\) at \(x=0.4\), remains relatively flat at \(0.11\) through \(x=0.8\), and decreases to \((1.2, 0)\).
- The dashed-dotted line, corresponding to \(u_j^2\) (marked with stars), starts at \((0, 0)\), rises to a peak value of approximately \(0.07\) at \(x=0.4\), stays at a similar level of \(0.06\) through \(x=0.8\), and finally reaches \((1.2, 0)\).
- All three functions are non-negative and appear to be solutions to a problem described in the surrounding context.