Long description: d3
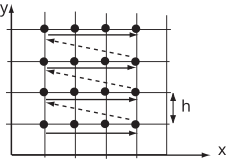
Alt text: A diagram showing a grid with marked points and dashed lines illustrating the stencil for a numerical method.
This description was generated by AI and has not been verified by a human. If you spot an error, please use the feedback link below.
- The image displays a two-dimensional coordinate system with horizontal and vertical axes labeled with \(x\) and \(y\), respectively.
- A rectangular grid is drawn, representing discrete points.
- Several points are marked with solid black circles at the intersections of the grid lines.
- Three distinct horizontal dashed lines are drawn, connecting three points in the center row, suggesting a discrete line segment or stencil.
- Three distinct vertical dashed lines are drawn, connecting three points in the central column, also suggesting a discrete line segment or stencil.
- The overall arrangement visualizes a finite difference stencil on a grid, where the spacing in the \(y\)-direction is labeled as \(h\) on the right side of the figure.