Long description: Fig1P
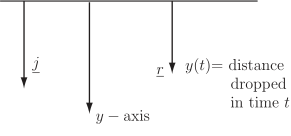
Alt text: A diagram illustrating the variable \(j\) and the function \(y(t)\), representing the distance dropped in time \(t\), positioned along the vertical axis labeled \(y\)-axis.
This description was generated by AI and has not been verified by a human. If you spot an error, please use the feedback link below.
- The image features a vertical axis labeled as the \(y\)-axis.
- Two quantities, \(j\) and \(y(t)\), are indicated by arrows pointing downwards along this axis.
- The quantity \(y(t)\) is explicitly labeled with the text "distance dropped in time \(t\)", corresponding to the arrow further to the right.
- The variable \(j\) is labeled by an arrow positioned further to the left on the same vertical axis.