Long description: Fig3P
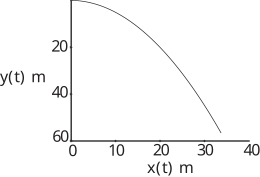
Alt text: A graph showing a downward-curving trajectory, labeled with horizontal distance x(t) in meters on the bottom axis and vertical position y(t) in meters on the side axis.
This description was generated by AI and has not been verified by a human. If you spot an error, please use the feedback link below.
- The graph plots the vertical position, \(y(t)\), in meters on the left vertical axis against the horizontal distance, \(x(t)\), in meters on the bottom horizontal axis.
- The curve starts at the top left, indicating a higher initial value for \(y(t)\) when \(x(t)\) is zero.
- The trajectory shows a gradual downward slope as \(x(t)\) increases, demonstrating that the object is falling over time.
- The curve passes through approximately \((10 \text{ m}, 24 \text{ m})\), \((20 \text{ m}, 34 \text{ m})\), and \((30 \text{ m}, 56 \text{ m})\).
- The curve ends near the bottom right corner of the visible plotting area, near \(x(t) = 35 \text{ m}\) and \(y(t) \text{ meters}\).
- Based on the provided context, the graph represents the trajectory of an object thrown horizontally from a bridge at \(10 \text{ meters per second}\), ignoring air resistance.