Long description: Fig4P
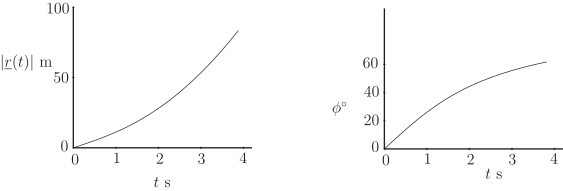
Alt text: Two graphs show the magnitude of position vector, |r(t)|, in meters and the angle, \(\phi^\circ\), in degrees, both plotted against time, \(t\), in seconds.
This description was generated by AI and has not been verified by a human. If you spot an error, please use the feedback link below.
- The left graph plots the magnitude of the position vector, \(|r(t)|\), versus time, \(t\).
- The vertical axis is labeled \(|r(t)|\) in meters, ranging from \(0\) to \(100\) meters.
- The horizontal axis is labeled \(t\) in seconds, ranging from \(0\) to \(4\) seconds.
- A curve is plotted, starting near \((0, 0)\) and increasing monotonically, passing through approximately \((2, 25)\) and ending near \((4, 80)\) meters.
- The right graph plots the angle, \(\phi^\circ\), versus time, \(t\).
- The vertical axis is labeled \(\phi^\circ\) in degrees, ranging from \(0\) to \(70\) degrees.
- The horizontal axis is labeled \(t\) in seconds, ranging from \(0\) to \(4\) seconds.
- A curve is plotted, starting at \((0, 0)\) and increasing monotonically, passing through approximately \((2, 30)\) degrees and ending near \((4, 60)\) degrees.