Long description: Fig31P
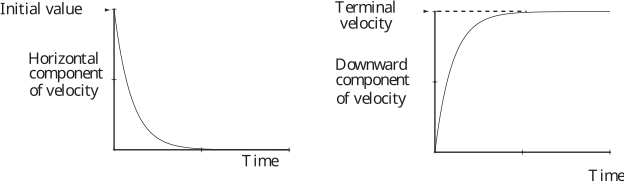
Alt text: The image displays two graphs showing the velocity components of an object moving through a fluid: the horizontal component decreasing and the downward component increasing, eventually leveling off.
This description was generated by AI and has not been verified by a human. If you spot an error, please use the feedback link below.
- The left graph plots the initial value (or horizontal component) of velocity against time, showing a curve that starts at a positive value and decreases, approaching zero as time increases.
- The right graph plots the terminal velocity (or downward component) of velocity against time, showing a curve that starts at zero and increases, leveling off at a positive, constant maximum value representing terminal velocity.