Long description: Fig32P
Alt text: A graph showing two parabolic trajectories, one solid and one dashed, plotted against horizontal distance and height.
This description was generated by AI and has not been verified by a human. If you spot an error, please use the feedback link below.
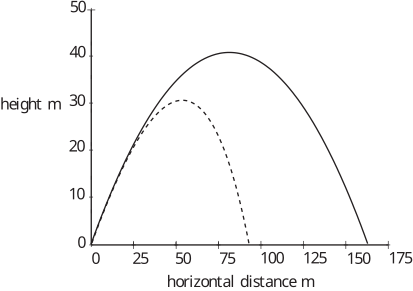
- The graph plots height in meters on the vertical axis against horizontal distance in meters on the horizontal axis.
- A solid curve represents the predicted trajectory of an object projected at forty-five degrees with a speed of forty meters per second, indicating motion in the absence of air resistance.
- A dashed curve represents the predicted trajectory with air resistance proportional to velocity, using a constant kappa of zero point one eight four.
- Both curves start at the origin, indicating zero height and zero horizontal distance.
- The solid curve reaches a maximum height of approximately thirty-eight meters at a horizontal distance of about seventy-five meters, and it lands at a horizontal distance of approximately one hundred fifty meters.
- The dashed curve rises to a maximum height of approximately thirty meters at a horizontal distance of about fifty meters, and it lands at a horizontal distance of about one hundred meters.