Long description: Fig34P
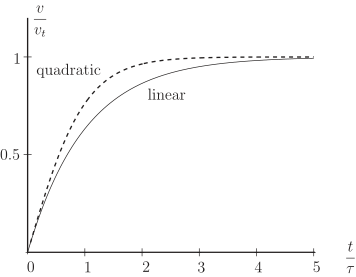
Alt text: A graph comparing the variation of vertical velocity, \(v_t\), over time, \(t/\tau\), for an object subject to linear and quadratic air resistance.
This description was generated by AI and has not been verified by a human. If you spot an error, please use the feedback link below.
- The graph displays the vertical velocity, \(v_t\), on the vertical axis and the dimensionless time, \(t/\tau\), on the horizontal axis.
- Two curves are plotted: one labeled "quadratic" and one labeled "linear."
- Both curves start at the origin (zero velocity at zero time).
- The dashed curve, representing "quadratic" resistance, increases more steeply initially and appears to approach a limiting value of approximately \(1.0\) more slowly than the other curve.
- The solid curve, representing "linear" resistance, also increases over time, approaching a limiting value that appears slightly lower than the quadratic case's apparent asymptote.
- At \(t/\tau = 5\), both curves are relatively close to each other, with the quadratic resistance curve showing a slightly higher velocity.