Long description: figure5
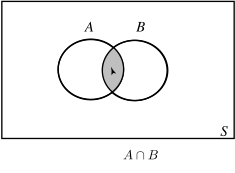
Alt text: The diagram shows two overlapping circles labeled A and B, with the overlapping region shaded to represent the intersection, \(A \cap B\).
This description was generated by AI and has not been verified by a human. If you spot an error, please use the feedback link below.
- The image displays a Venn diagram representing a universal set, labeled \(S\).
- Inside this universal set, there are two overlapping sets, represented by large circles, labeled \(A\) and \(B\).
- The region where the two circles overlap is shaded gray, indicating the intersection of the two sets, written as \(A \cap B\) below the diagram.