Long description: event
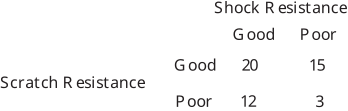
Alt text: A table displays quantitative data comparing 'Shock Resistance' and 'Scratch Resistance' for 'Good' and 'Poor' performance levels.
This description was generated by AI and has not been verified by a human. If you spot an error, please use the feedback link below.
- The image presents comparative data organized in a table format.
- The first row of data is labeled 'Shock Resistance'.
- For 'Shock Resistance', the value associated with 'Good' is 20, and the value associated with 'Poor' is 15.
- The second row of data is labeled 'Scratch Resistance'.
- For 'Scratch Resistance', the value associated with 'Good' is 12, and the value associated with 'Poor' is 3.