Long description: fig1
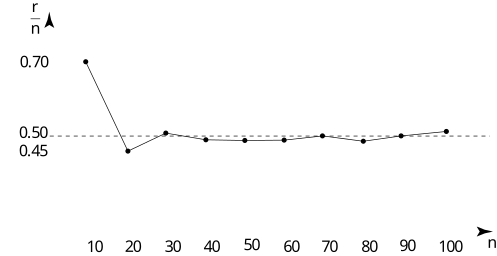
Alt text: A line graph titled "r/n" versus "n" shows values fluctuating around 0.50 for values of n ranging from 10 to 100.
This description was generated by AI and has not been verified by a human. If you spot an error, please use the feedback link below.
- The graph displays a function represented by points connected by a line, with the vertical axis labeled "r/n" and the horizontal axis labeled "n".
- At a value of "n" equal to 10, the "r/n" value is approximately 0.70.
- As "n" increases to 20, the "r/n" value drops sharply to a level below 0.50, near 0.46.
- For values of "n" ranging from 20 through 100, the "r/n" value remains relatively stable, fluctuating slightly around a dashed horizontal line marked at 0.50.
- Specifically, the values at "n"=30, "n"=40, "n"=50, "n"=60, "n"=70, "n"=80, "n"=90, and "n"=100 are all close to or slightly below the 0.50 mark.