Long description: Block221_Fig10
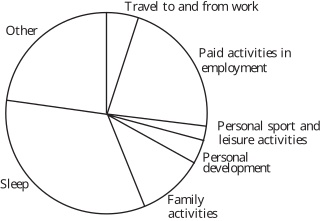
Alt text: A pie chart illustrating the proportion of time spent on various activities, including sleep, family activities, and employment.
This description was generated by AI and has not been verified by a human. If you spot an error, please use the feedback link below.
- The pie chart is divided into several labeled segments representing different time allocations.
- The segments include: "Travel to- and from work," "Paid activities in employment," "Personal sport- and leisure activities," "Personal development," "Family activities," "Sleep," and "Other.".
- The size of each segment visually represents the relative amount of time dedicated to that activity.