Long description: Block221_Fig1
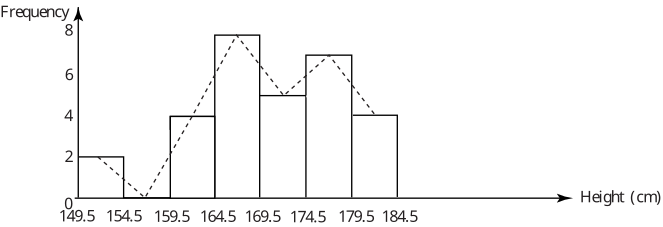
Alt text: A bar graph showing the frequency distribution of heights in centimeters.
This description was generated by AI and has not been verified by a human. If you spot an error, please use the feedback link below.
- The horizontal axis represents height in centimeters, ranging from 149.5 to 184.5. The vertical axis represents frequency, scaled from 0 to 8.
- The bar graph displays data across several height intervals.
- The frequency for the first visible interval, between 149.5 and 154.5 centimeters, is 2.
- The next interval, from 154.5 to 159.5 centimeters, has a frequency of 4.
- The interval from 159.5 to 164.5 centimeters shows the highest frequency, reaching 8.
- Following this, the frequency for the interval from 164.5 to 169.5 centimeters is 5.
- The interval from 169.5 to 174.5 centimeters has a frequency of 7.
- The last plotted interval, from 174.5 to 179.5 centimeters, has a frequency of 6.
- Finally, the interval from 179.5 to 184.5 centimeters shows a frequency of 4.